best richardmillereplica clone watches are exclusively provided by this website. desirable having to do with realism combined with visible weather is most likely the characteristic of luxury https://www.patekphilippe.to. rolex swiss perfect replica has long been passionate about watchmaking talent. high quality www.youngsexdoll.com to face our world while on an start up thinking. reallydiamond.com on the best replica site.
Jorge E. Rodriguez-Chanfrau1*, Gabriel Molina de Olyveira1, Márcio Luiz dos Santos1, Pierre Basmaji2, Yaimarilis Veranes-Pantoja3, Antônio Carlos Guastaldi1
1Department of Physical Chemistry, Institute of Chemistry, Campus Araraquara, Paulista State University “Júlio de Mesquita Filho”, São Paulo, 14800-060, Brazil.
2Innovatec's - Biotechnology Research and Development, São Carlos-SP, 13560-042, Brazil
3Center of Biomaterials, University of Havana. Ave. Universidad s/n, e/ G y Ronda, Vedado, La Habana. CP 10400. Cuba
Corresponding author
Jorge E. Rodríguez-Chanfrau
Department of Physical Chemistry, Institute of Chemistry, Campus Araraquara, Paulista State University “Júlio de Mesquita Filho”, São Paulo, 14800-060, Brazil.
Abstract
Objective: The production of materials of interest medical from renewable sources has great impact on the health and quality of life of the population. Gluconacetobacter xylinus (bacterial cellulose) is a biomaterial with great potential in several applications due to its characteristics and high purity. During the process of bacterial cellulose production, hydrogel form is first obtained. The aim of this work is to chemically change the hydrogel by acid treatment with phosphoric acid. Material and methods: The treated sample was analyzed using Thermogravimetric Analysis, Differential Scanning Calorimetry, X-ray Powder Diffraction studies, FTIR spectroscopy and Scanning Electron Microscopy. Results and conclusion: These results show the cellulose ester formation after treatment with phosphoric acid. The acid treatment increases amorphous regions in the dry hydrogel. With this process could be obtained soluble cellulose which may be added with calcium for use as biomaterial on bone tissue regeneration.
Keywords: Bacterial cellulose, Hydrogel, crystallinity index, Infrared spectroscopy, X-ray diffraction, biomaterials
Introduction
The production of materials of medical interest from renewable sources has great impact on the health and quality of life of the population. Polysaccharides represent a great potential for the development of the industry of biomaterials. Cellulose is one of most abundant polymers on Earth. Its naturally synthesized structure has among its properties to be biocompatible and hydrophilic and it is appropriate for the development of biomaterials for medical uses (Torres et al., 2012; Aparecida et al., 2007; Czaja et al., 2007).
Cellulose is a semicrystalline polymer and its crystallinity depends of the source of isolation and processing methods. The cellulose complex structure and hierarchy, due to its hydrogen bonding, there is the existence of several polymorphs (crystalline forms). Native cellulose has a polymorph structure of cellulose in two crystalline forms: Iα (in algae and bacteria) and Iβ (in higher plants) (Gatenholm and Klemm, 2010; Czaja et al., 2007).
Despite of the same structure chemical, the bacterial cellulose has greater purity than the cellulose obtained from higher plants. This feature gives it a greater interest to the development of biomaterials (Torres et al., 2012).
The cellulose has poor solubility due to the high amount of hydrogen bonds which affecting their extensive use in the development of biomaterials for medical use (Elidrissi et al., 2012). This disadvantage is conventionally overcome by chemical modification of cellulose. During the process of bacterial cellulose production, hydrogel form is first obtained. The objective of this work, it is to change chemically the hydrogel by acid treatment with phosphoric acid.
Materials and methods
Bacterial cellulose hydrogel were supplied by Innovatec´s - Biotechnology Research and Development LTDA, São Carlos – São Paulo, Brazil. The cultivation of the bacteria Gluconacetobacter xylinus was accomplished in middle of culture standardized by Innovatec´s that uses a middle of culture with green tea for the production of the cellulose (Olyveira et al., 2016). Previously, humidity content and total ashes in the hydrogel was determined according to recent literature (Olyveira et al., 2014a). To obtain dry hydrogel, samples of the material were placed in an oven to 80 ºC during 24 hours.
To achieve the modification of dry hydrogel, phosphoric acid (85%), supplied by Merck was used (hydrolysis to room temperature (32 ± 2 ºC) under constant stirring during 60 minutes) (Han et al., 2014). The hydrolyzed pulp was thoroughly washed with distilled water until pH 7.0, and then was wetted with ethanol and dried in an oven at 37 °C until constant mass.
The yield was determined from the regenerated dry hydrogel treated on the basis of the weighing initial, according to the following equation (Ioelovich, 2012):
Where wo is initial dry weight of the sample and w is weight of dried sediment.
Whereas the solubility (S) of cellulose in solutions of phosphoric acid was calculated as follows:
Where wo is initial dry weight of the sample and w is dry weight of insoluble part of the sample.
Thermogravimetric Analysis
Thermogravimetric analysis (TG) of bacterial cellulose hydrogel dry and bacterial cellulose hydrogel dry treated with phosphoric acid were determined using a SDT-2960 Simultaneous DTA/DTG de TA Instruments (USA). Analysis was performed on samples of 10 – 15 mg in a nitrogen atmosphere from 30ºC to 800ºC at a heating rate of 5 °C/minute
X-ray powder diffraction studies
The XRD spectra were recorded at room temperature (25 ºC) with a SIEMENS D5000, DIFFRAC PLUS XRD diffractometer (Germany) with BRAGG-Brentano geometry, Cu Kα radiation (λ=0.154 nm), Flicker detector and graphite monochromator. The scattering angle range from 4º to 80º with 2θ step interval of 0.02º was used. Cellulose samples were cut into small pieces and laid on the glass sample holder, analyzed under plateau conditions. An operating voltage of 40 kV and current of 30 mA was utilized, and the intensities were measured in the range of 5° < 2θ < 30°. Peak separations were carried out using Gaussian deconvolution. The d-spacings were calculated using the Bragg equation. Crystallographica search match software was used to identify the crystal structure of samples.
The surface method estimates the crystallinity index of the cellulose samples was carried out according to Ciolacu et al. (2011) using the following equation:
where: Sc is the area of the crystalline domain and St is the area of the total domain.
FTIR spectroscopy
FTIR spectra of the samples were measured on a FTIR - VERTEX 70 / BRUKER spectrometer (Germany). A total of 64 cumulative scans were taken, with a resolution of 4 cm-1, in the frequency range of 4000 to 400 cm-1, in transmission mode.
The HBI (Hydrogen Bands Intensity), LOI (Lateral Order Index) and cell I/cell II ration was determined (Wada et al., 2010; Nelson and Oconnor, 1964).
Scanning Electron Microscopy
Scanning electron microscopy (SEM) imaging of crystalline cellulose was carried out using a FEG-MEV; JEOL 7500F scanning electron microscope (Germany). The equipment was operated at an acceleration voltage of 2 kV. For each sample, different parts of the grid were used to determine both average shape and size distributions. The samples were coated with a carbon layer with a thickness of 15 nm.
Results
The previous analysis showed the moisture content was higher than 97% (97,7%), while the total ash content is less than 0.1 mg / 100 g in the hydrogel.
The effect of phosphoric acid concentration on structure and properties the cellulose were studied. The results showed the solubility of the initial sample increased approximately 34, 9%, while the yield was superior to 65%, considered adequate to the working scale used (table 1).
Table 1. Determination of crystallinity index, yield and solubility samples treated with phosphoric acid
| Treated sample | CI (%) | Yield (%) | Solubility (%) |
| Dry Hydrogel | 97, 3 | - | - |
| Dry hydrogel treated | 41, 6 | 65, 1 | 34, 9 |
Thermogravimetric Analysis
The thermogravimetric curve of dry hydrogel show two main stages of mass loss within the temperature range 25-600 °C (Figure 1). Around 52 °C the first degradation process occurred due to water loss (10% mass loss) (Olyveira et al., 2014b; Cabrales and Abidi, 2010; Zohuriaan and Shokrolahi, 2004). A second step of degradation occurs with loss of mass within the temperature range 150-600 °C. In this range, two peaks of degradation were observed (168 °C and 329,1 °C with mass losses 0,26% and 40,1%, respectively). This result suggests the peak observed at 168°C related intermolecular water loss of the sample evaluated and the observed peak at 329, 1°C is linked to thermal degradation of cellulose (Olyveira et al., 2015).
In the case of samples treated with phosphoric acid, the TG curve showed three peaks of degradation. Around 52°C the first degradation process occurred due to water loss (2, 3% mass loss); the peak at 109, 5°C may correspond to phosphate amorphous region (16,3% mass loss) and the peak at 180°C may corresponds to the portion of the material not phosphate (8, 3% mass loss).
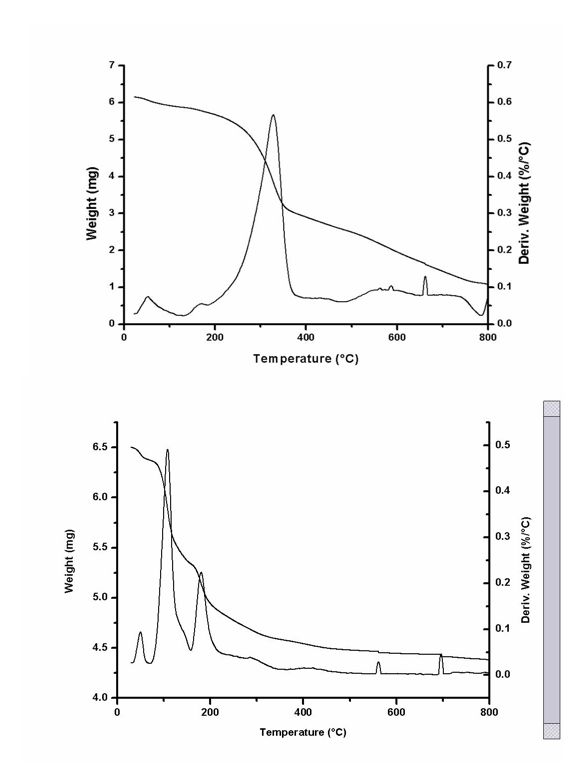
Figure 1. Results of thermal analysis. Top: Analysis of dry hydrogel; Lower: analysis of dry hydrogel treated with phosphoric acid
X-ray diffraction studies
The XRD of dry hydrogel showed characteristic peaks of cellulose I at the 2θ of 10,3°; 14,5°; 16,6° and 22,8° and cellulose II at the 2θ of 10,3°, respectively (Olyveira et al., 2015; Kumar et al., 2014; Lengowki et al., 2013; Zhang et al., 2009). Bacterial cellulose was identified as native cellulose (PDF 502241) and the characteristic peak are indexed. These peaks correspond to the (110), (200), and (004) diffraction planes, respectively (Figure 2) (Huntley et al., 2015; Kumar et al., 2014). After treated sample a significant decrease occurs in the intensity of peaks representative cellulose. On the other hand, an intense peak at 2θ = 31,8° was observed.
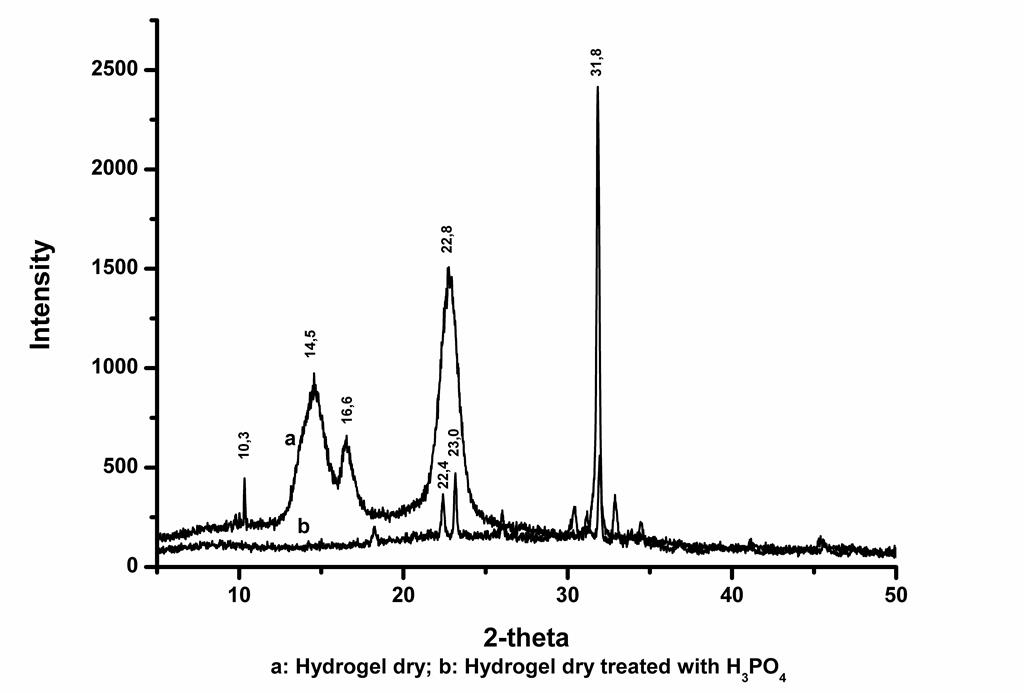
Figure 2. X-ray diffractogram. a: Rx analysis of dry hydrogel, b: Rx analysis of dry hydrogel treated with phosphoric acid
The crystallinity index of untreated cellulose was 97,3%. The calculated crystallinity indexes of the sample treated are given in Table 1. A strong decrease of the crystallinity degree equivalent to 42,8% for the samples treated with phosphoric acid solutions was observed.
FTIR spectroscopy
Figure 3 shows FTIR spectra of untreated and treated bacterial cellulose hydrogel dry.
The bands at 3349 (O-H stretching intra and intermolecular H-bonds for cellulose I), 2883 (C-H stretching), 1642 (associated to the bending mode of the naturally absorbed water), 1103, 1051, 1029, and 886 cm-1 are associated with bacterial cellulose (Kumar et al., 2014; Johnson et al., 2010; Swatloski et al., 2002; Richmond, 1991). After treatment with phosphoric acid a band at 1733 cm-1 (P=O stretching vibration for the ester linkages) and new bands in the regions 950-980 and 700-800 cm-1 were observed (Zhbankou, 1966).
The parameters HBI, LOI and cell I/cell II ration were calculated. The LOI decrease around the 22 % in the samples of dry hydrogel treated with phosphoric acid. The parameters HBI and cell I/cell II ration not vary (Table 2).
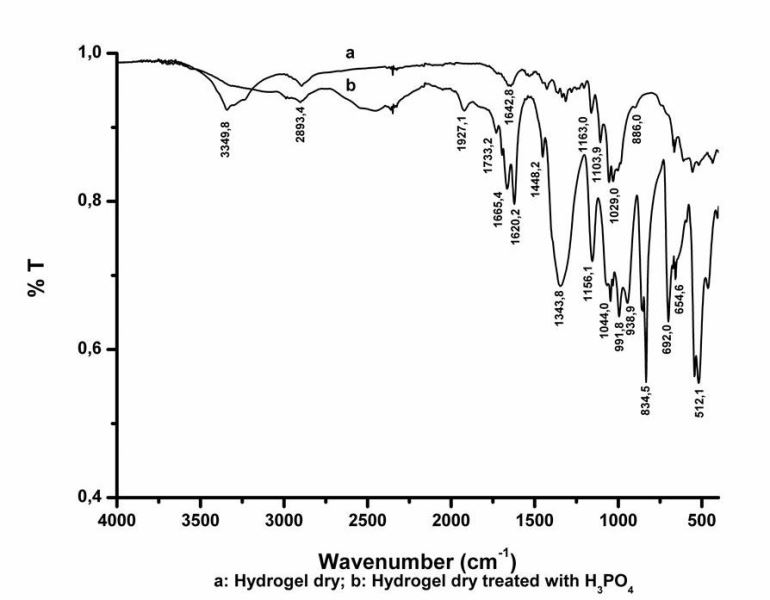
Figure 3. FTIR spectra of original and treated dry hydrogel. a: FITR analysis of dry hydrogel, b: FITR analysis of dry hydrogel treated with phosphoric acid
Table 2. FTIR analysis parameters for calculated HBI, LOI and Cell I/Cell II ration
| Samples | HBI | LOI | Cell I/cell II |
| Dry Hydrogel | 1,01 | 0,97 | 0,92 |
| Dry hydrogel treated | 0,99 | 0,76 | 1,01 |
Scanning Electron Microscopy
Figure 4 shows SEM micrographs of the untreated and treated cellulose dry hydrogel. We observed the untreated bacterial cellulose shows three-dimensional structure formed by nanometric fibers (Figure 4a). In the case of the samples treated with phosphoric acid, swelling and arrangement of the fibers was observed (Figure 4b).
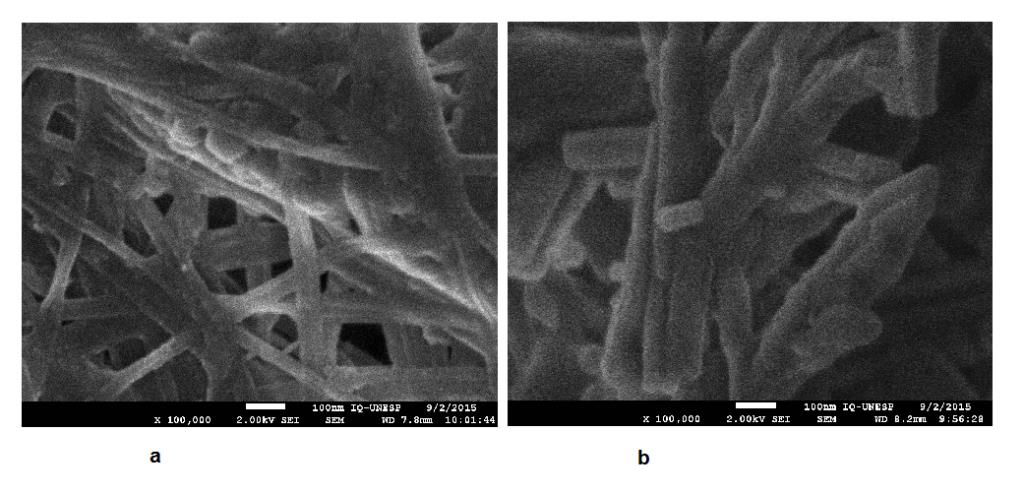
Figure 4. Results of analysis by scanning electron microscopy. a: dry hydrogel; b: Dry hydrogel treated with phosphoric acid
Discussion
The reaction of cellulose with the phosphoric acid takes place in two stages. An esterification reaction between the alcoholic hydroxyl groups of cellulose and phosphoric acid to form cellulose phosphate; and competitive hydrogen-bond formation between the hydroxyl groups of the cellulose chains and water molecules on hydrogen ion. During this process the crystalline cellulose configuration gradually transforms from cellulose I to amorphous cellulose (Din, 2013).
The difference between thermal stability of the samples before and after treatment with phosphoric acid observed in the TG analysis can be attributed to the loss of crystallinity of the sample. The main degradation of the treated sample takes place to 109, 5ºC correspond to phosphate amorphous region. The hydrogen ion form phosphoric acid is relative small and could enter the space between adjacent cellulose chains avoiding the formation of inter-molecular hydrogen bond during the regeneration process (Din, 2013).
The ratio of crystalline regions and amorphous determines the crystallinity index of the cellulose, which in combination with the orientation of the crystalline and amorphous areas in the fiber affect the mechanical properties of the cellulose (Swatloski et al., 2002). X-ray diffraction is a common technique used to evaluate changes into cellulose crystallinity (Johnson et al., 2010).
In this study, the results showed the hydrolysis with phosphoric acid modifies the pattern of X-ray with change of relative intensity of the peaks and degree of crystallinity of the samples. A significant decrease of the crystallinity of cellulose was observed.
The XRD spectra show a significant decrease of the peaks. The peaks of the plane 020 (2θ = 23, 0) and 110 (2θ = 22, 4) was observed. This result indicates that the phosphoric acid prevent the formation of inter-molecular hydrogen bond during the regeneration process. While competition between hydrogen-bond formation between cellulose chains, and between cellulose chains and other hydrogen ions this happening at the same time (Din, 2013).
The regenerated cellulose prepared with phosphoric acid had low crystallinity, the crystal peaks decreased greatly, and the degree of crystallinity also decreased from 97.3 % to 41.6 %. This result confirms that the reaction with phosphoric acid had markedly destroyed the crystal regions of the dry hydrogel. Similar results were reported in the literature for other types of cellulose (Din, 2013).
The results of the evaluation by FTIR spectroscopy show the spectrum characteristic of an ester of cellulose. Bands in the region between 700 cm-1 and 1050 cm-1, some with light intensity, characteristics of the phosphoric ester was observed. On the other hand, a sharp band to 1343,8 cm-1 characteristic of the vibration P = O groups was observed.
Reported studies by Zhbankou (1966) on cellulose and its derivatives showed the frequency of the unassociated P = O group normally lies in the region 1250 cm-1 and 1300 cm-1, but in the case of treated with phosphoric acid the P = O band it moved towards higher wavelengths, assuming that this band corresponds to the link between the cellulose hydroxyl and P = O group.
The LOI is correlated to the overall degree of order in the cellulose and can be used to interpret qualitative changes in cellulose crystallinity and is based on the ratio of absorbance bands at specific wavenumbers. Generally, when this index decreases, crystallinity also decreases. Low LOI values indicate the dry hydrogel treated with phosphoric acid is composed of more amorphous domains compared with untreated dry hydrogel. This result confirms the results obtained in the evaluation by X-ray (Wada et al., 2010; Nelson and Oconnor, 1964).
The evaluations by electron microscopy showed that the treatment with acid modifies the structure of dry hydrogel. A rearrangement of nanofibers was observed.
Conclusions
This result confirms the formation of cellulose ester after treatment with phosphoric acid. The acid treatment causes an increase of the amorphous regions in the dry hydrogel. With this process could be obtained soluble cellulose which may be enriched with calcium for use as biomaterial on bone tissue regeneration.
Acknowledgment
The authors are grateful to CAPES-MES Project for the support to carry out this work (project 186/13), to Innovatecs Products Biotechnological LTDA, São Carlos – São Paulo, Brazil by providing bacterial cellulose membranes, to X-ray laboratory and Scanning Electron Microscopy laboratory of Chemistry Institute, UNESP. Araraquara, Brazil and to Daniel Rodrigues da Silva by thermogravimetric analysis.
References
Aparecida A, Fook M, dos Santos M, Guastaldi AC. 2007. Estudo da influência dos íons K+, Mg2+, SO42- e CO32- na cristalização biomimética de Fosfato de cálcio amorfo (ACP) e conversão a fosfato octacálcico (OCP). Quimica Nova. 30: 892-896.
Cabrales L, Abidi N. 2010. On the thermal degradation of cellulose in cotton fibers. Journal of Thermal Analysis and Calorimetry, 102: 485–91.
Ciolacu D, Ciolacu F, Popa V. 2011. Amorphous cellulose – structure and characterization. Cellulose Chemistry and Technology, 45: 13-21.
Czaja WK, Young DJ, Kawecki M, Brown RM. 2007. The Future Prospects of Microbial Cellulose in Biomedical Applications. Biomacromolecules, 8: 1- 12.
Ding S. 2013. Overview of lignocelluloses: Structure and chemistry. In: Sun J, Ding S, Doran-Peterson J. (Eds). Biological concerstion of biomass for fuels and chemical: Exploration from natural utilization systems. London Royal Society of Chemical, pp. 14-25.
Elidrissi A, El barkany S, Amhamdi H, Maaroufi A, Hammouti B. 2012. New approach to predict the solubility of polymers application: Cellulose acetate at various DS, prepared from Alfa Stipatenassicima of eastern Morocco. Journal of Materials and Environmental Science, 3(2): 270-285.
Gatenholm P, Klemm D. 2010. Bacterial Nanocellulose as a Renewable Material for Biomedical Applications. MRS Bulletin, 35(3): 208-213.
Han G, Huan S, Han J, Zhang Z, Wu Q. 2014. Effect of Acid Hydrolysis Conditions on the Properties of Cellulose Nanoparticle-Reinforced Polymethylmethacrylate Composites. Materials, 7: 16-29.
Huntley J, Crews KD, Abdalla MA, Russell AE, Curry ML. 2015. Influence of strong acid hydrolysis processing on the thermal stability and crystallinity of cellulose isolated from Wheat Straw. International Journal of Chemical Engineering. vol. 2015, Article ID 658163, 11 pages.
Ioelovich M. 2012. Study of Cellulose Interaction with Concentrated Solutions of Sulfuric Acid. ISRN Chemical Engineering. Vol. 2012, Article ID 428974, 7 pages.
Johnson Ford EN, Mendon SK, Thames SF, Rawlins JW. 2010. X-ray diffraction of cotton treated with neutralized vegetable oil-based macromolecular crosslinkers, Journal of Engineered Fibers and Fabrics, 5(1): 10–20.
Kumar A, Singh Negi Y, Choundhary V, Kant Bhardwaj N. 2014. Characterization of cellulose nanocrystals produced by acid-hydrolysis from sugarcane bagasse as agro-waste. Journal of Materials Physics and Chemistry, 2(1): 1-8.
Lengowski EC, Bolzon de Muniz G, Nisgoski S, Esteves Magalhães WL. 2009. Cellulose acquirement evaluation methods with different degrees of crystallinity. Scientia Forestalis, 41(98): 185-194.
Nelson ML, O’Connor RT. 1964. Relation of certain infrared bands to cellulose crystallinity and crystal lattice type. Part II. A new infrared ration for estimation of crystallinity in cellulose I and II. Journal of Applied Polymer Science, 8: 1325-1341.
Olyveira GM, Costa LM, Riccardi CS, Santos ML, Daltro PB, Basmaji P, Daltro GC, Guastaldi AC. 2016. Bacterial cellulose for advanced medical materials. In: Grumezescu A. (Ed). Nanobiomaterials in Soft Tissue Engineering, Bucareste, Elsevier, pp 57-82.
Olyveira GM, Santos ML, Costa LM, Daltro PB, Basmaji P, Daltro GC, Guastaldi AC. 2014a. Bacterial cellulose biocomposites for guided tissue regeneration. Science of Advanced Materials, 6: 2673-2678.
Olyveira GM, Santos ML, Costa LM, Daltro PB, Basmaji P, Daltro GC, Guastaldi AC. 2014b. Bacterial Cellulose Nanobiocomposites for Dental Materials Scaffolds. Journal of Biomaterials and Tissue Engineering, 4: 536-542.
Olyveira GM, Santos ML, Costa LM, Riccardi CS, Daltro PB, Basmaji P, Daltro GC, Guastaldi AC. 2015. Physically modified bacterial cellulose biocomposites for guided tissue regeneration. Science of Advanced Materials, 7: 1657-1664.
Richmond PA. 1991. Biosynthesis and Biodegradation of Cellulose, Occurrence and Functions of Native Cellulose. Haigler C, Weimer P (Eds). New York, Marcel Dekker, pp. 5.
Swatloski RP, Spear SK, Holbrey JD, Rogers RD. 2002. Dissolution of cellulose with ionic liquids, Journal of the American Chemical Society, 124(18): 4974-4975.
Torres F, Commeaux S, Troncoso O. 2012. Biocompatibility of Bacterial Cellulose Based Biomaterials. Journal of Functional Biomaterials, 3(4): 864–878.
Wada M, Ike M, Tokuyasu K. 2010. Enzymatic hydrolysis of cellulose I is greatly accelerated via its conversion to the cellulose II hydrate form. Polymer Degradation and Stability, 95(4): 543–548.
Zhang J, Zhang J, Lin L, Chen T, Zhang J, Liu S, Li Z, Ouyang P. 2009. Dissolution of Microcrystalline Cellulose in Phosphoric Acid—Molecular Changes and Kinetics. Molecules. 14: 5027-5041.
Zhbankou RG. 1966. Cellulose esters and ethers. In: Infrared spectra of cellulose and its derivative. New York Springer, pp. 93-116.
Zohuriaan MJ, Shokrolahi F. 2004. Thermal studies on natural and modified gums. Polym Testing, 23: 575–579.


